Key Takeaways:
-
Technical analysis assumes efficient markets, trend persistence, and historical pattern repetition, some of which are contradictory
-
Techniques include identifying trends, recognizing patterns, and using technical indicators to identify market trends and possible turning points
-
Critics argue it lacks theoretical grounding, is based on subjective interpretations of patterns and works only as a self-fulfilling prophecy
-
Proponents value its practicality in navigating complex markets and short-term investing
In the fast-paced world of finance, where markets fluctuate, and decisions are made in the blink of an eye, investors rely on various tools to give them an edge over other market participants. Among these tools, technical analysis stands as a prominent methodology, offering insights into market trends and patterns through the lens of price and volume data. However, we all know how controversial it is in the industry - some investors call it an effective strategy to gain profits from ongoing market trends, and others compare it to astrology… So which one is it? We shall dive into this debate shortly, but first, let’s define technical analysis and its different aspects.
Defining Technical Analysis
Formally, technical analysis is the approach of deciphering market behaviour by studying historical price and volume data, utilizing chart patterns, technical indicators, and other tools to forecast future price movements. It uses historical security price and volume data to forecast how prices will move in the future. The main idea of this approach is that all past and future information about the stock is already known in the current price - all known information is encompassed in the price (and its movements), and there is no additional source needed. However, if we consider the mechanics of technical analysis, which is based on trying to profit from past data and movements of the stock prices, this begins to contradict with the notion of all (past and current) information being encompassed in the price. If it’s all priced in, then trading on past patterns should not produce any profit - right?
The notion of technical analysis stands on three major assumptions or theories based on which the market operates:
-
Market discounts everything - Markets are efficient and ensure all information about the stock is priced in. Ideally, this would be the case, but how could private information be priced in if markets are not aware of it? In a more realistic argument, we could assume only public information, including fundamental factors of the company, broader economic factors and even behavioural aspects of investors, is priced in.
-
Prices move in trends - Instead of sporadic movements, prices are thought to follow past trends rather than move against them.
-
History repeats itself - Price movement trends are assumed to repeat because market participants tend to consistently repeat their reactions to events in the market, causing price trends to repeat as well.
The latter two assumptions conflict with the academic theory of efficient market hypothesis, where even its weak form is not satisfied here since past patterns are assumed to dictate future price movements - contrasting even the first assumption made above. We begin to understand why many are so sceptical.
Different Aspects of Technical Analysis
Several focuses of technical analysis have emerged, each with its own set of tools and principles. One popular approach is trend analysis, which seeks to identify and ride the prevailing market trend which is identified by reading candlesticks and recognizing price patterns - think momentum strategy, which simply aims to capitalize on the continuance of an existing trend. If you see an increasing price trend, you can assume this pattern to continue, even without more specific knowledge. The question becomes: for how long can you assume this, and when will this trend stop?
Figure 1: Trend and momentum

Source: Trading Setups Review
Another is pattern recognition, where chart formations such as head and shoulders, double tops, and triangles are used to predict potential reversals or continuations, i.e., whether a certain pattern continues or is expected to change. This is definitely the more controversial part of technical analysis, where the meaning behind these identified patterns is often not only questioned but also ridiculed. Nevertheless, some use these patterns to dictate their next move based on particular stock movements.
Figure 2: Overview of selected patterns

Source: Trading View
The most respected approach within the realm of technical analysis is using technical indicators - which are based on mathematical calculations using historical price, volume, and/or open interest data - to predict future price movements. They include moving averages, Relative Strength Index (RSI), Moving Average Convergence Divergence (MACD), Bollinger bands, Stochastic oscillators, Fibonacci retracements and several others. Since they offer quantitative insights into market momentum, overbought or oversold conditions, and potential support/resistance levels, they are more widely used.
The Great Debate: Is It a Good Approach?
Technical analysis is often employed in various financial markets, including equities, commodities, foreign exchange, and cryptocurrencies. Traders use these methods to time their entries and exits, manage risk, and devise trading strategies. Furthermore, the prevalence of algorithmic trading has led to the integration of technical indicators in trading algorithms, amplifying their impact on market movements.
However, critics argue that technical analysis lacks a solid theoretical foundation, often attributing observed patterns to mere coincidence. They assert that reliance on historical price data alone overlooks the underlying factors that truly drive market trends and ignores forward-looking factors. These can include relatively simple aspects like a change in the company’s management and future prospects that have not been priced into the stock price but could be observed through fundamental analysis. A supporter of technical analysis would argue that such changes would be priced in, yet investors can have different opinions and even wrong opinions, meaning relying on investors’ sentiment, which is reflected in the stock price, may not be the best approach. Remember the old saying, “Do the opposite of what the market does”?
Academics do not like it due to going against the efficient market hypothesis, and they have a point. Why should we assume future prices to move based on what happened in the past? They do say, “The best predictor of tomorrow’s stock price is today’s stock price”, but this doesn’t mean it’s yesterday’s or last week’s stock price…
Lastly, the subjectivity in interpreting chart patterns and indicators raises concerns about consistency and accuracy. The same pattern or indicator level can cause one investor to continue holding while the other scrambles to sell - it no longer sounds very reliable, does it?
Proponents counter that while technical analysis may not uncover the fundamental drivers of market behaviour, it provides a pragmatic approach to navigating the chaos of markets. It offers a common language for traders, allowing them to react quickly to changing conditions. Historical price movements capture the collective wisdom of market participants at that time and reflect psychological aspects of investing, too. Technical indicators help gauge market sentiment in a more quantitative manner. So, the critics’ argument of subjectivity plays in favour of technical analysis. If a large proportion of investors thinks alike and uses the same patterns to dictate their next move, the price movement becomes a self-fulfilling prophecy - if enough investors sell the stock at the same time because they expect the price to drop, then naturally, they push the price to drop. But is a strategy that works only due to a certain level of popularity actually good?
Comparing with Fundamental Analysis
Fundamental analysis is always placed in contrast to technical, as the more sound and accepted approach because it focuses on evaluating the intrinsic value of assets by assessing factors such as earnings, cash flows, and economic indicators. While fundamental analysis seeks to uncover the underlying worth of a security, technical analysis aims to exploit price patterns to predict future movements.
Critics of fundamental analysis argue that it can be slow to react to short-term market dynamics and can miss out on trends driven by sentiment and momentum. On the other hand, advocates view fundamental analysis as a more reliable approach, as it is rooted in concrete data and can provide a long-term perspective on market valuations.
Figure 3: Summary of Fundamental vs Technical Analysis
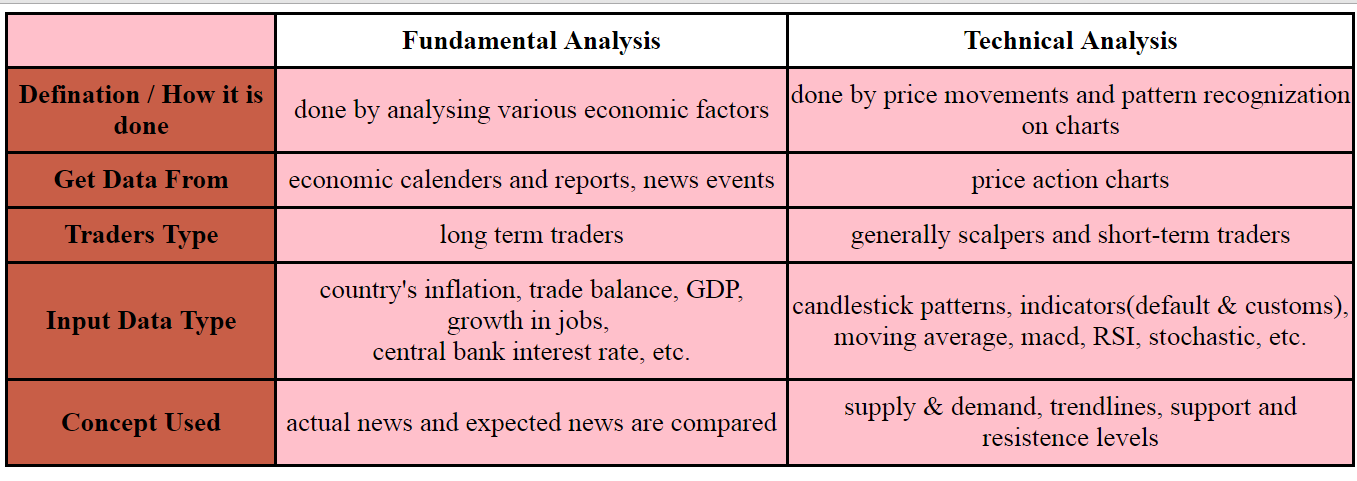
Source: Forex Academy
The general consensus is that technical indicators don’t have any long-term predictive power when used by themselves, but in combination with fundamental analysis, which focuses more on long-term aspects, they could be a powerful duo. After all, this is the approach taken by many professional analysts, and several, like Steve Cohen and Paul Tudor Jones, have managed to profit immensely from this combo.
Bottom Line
The question of whether technical analysis is a valid approach remains a subject of ongoing debate within the financial community. While it may lack the depth of fundamental analysis, its ability to swiftly react to market dynamics and identify short-term trends cannot be disregarded. As with any tool in a trader's arsenal, its effectiveness depends on the carefulness of the investor in making subjective judgments and the ability to integrate this with various approaches, not just as a sole strategy.
In the ever-evolving landscape of finance, both technical and fundamental analyses will continue to have their place, each offering a unique perspective on market behaviour. As traders navigate the complex interplay between price movements and underlying fundamentals, the combination of these approaches might hold the key to successful investing in a dynamic world. Those who have been disappointed by stocks moving opposite to the predictions of technical analysis far too many times and may be willing to consider passive index investing for a change should take a look at this article by Eolann.