Key Takeaways:
- Bond yields are barometers of market expectations for growth, inflation, interest rate risk, credit risk, and more.
- Theories about yields can explain recent developments in France’s, the UK’s, and China’s bond markets.
Bond yields have been a frequent topic in financial headlines, but what do their ups and downs tell us?
This article unveils the movements of government bond yields and the signals they provide. While yield time series exhibit random walk-like behavior, understanding the underlying drivers reveals a clearer story.
Finance 101: What Is the Interest Rate Composed Of?
Bond yields can be broken down into several components: the real risk-free rate, the inflation premium, the term premium, the credit risk premium and the liquidity premium.
The composition of these components varies across bond types, including government bonds, corporate bonds and private credit, explaining differences in their yields-to-maturity. Figure 1 below illustrates how these components differ.
Figure 1: Components of fixed income returns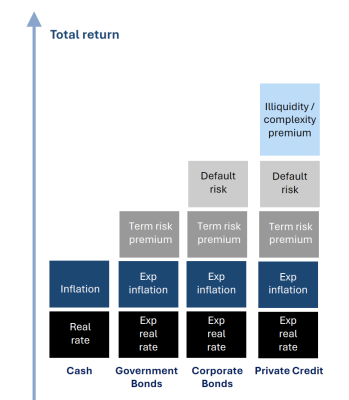
Let’s unpack these components in the context of government bonds.
1. The Risk-Free Rate
According to the Fisher Effect, Nominal Risk-Free Rate = Real Risk-Free Rate + Inflation Premium.
The real risk-free rate represents the risk-free return on an investment without inflation, while the inflation premium compensates investors for the loss of purchasing power due to inflation over the bond's life.
A simple way to separate the two components is by comparing inflation-linked bonds (ILBs) to conventional bonds. For example, U.S. Treasury Inflation-Protected Securities (TIPS) reflect the real yield, while the difference between TIPS and conventional Treasury yields represents inflation expectations (Figure 2).
Figure 2: 10-Year US Treasury Yield and TIPS Yield
2. Term Premium (or Maturity Premium)
The term premium compensates investors for holding longer-term bonds, which are more sensitive to interest rate changes. For instance, a 10-year bond carries more maturity risk than a 2-year bond due to its longer duration.
Duration is a relevant concept here. It measures the sensitivity of bond prices to yield changes and can be viewed as the weighted average of cash flow timing. For a 10-year bond that pays its principal at maturity, its duration will be closer to 10, as the last cash flow carries the largest weight. By contrast, a 2-year bond’s duration will be closer to 2.
Prices of bonds with longer duration change more with a 1% shift in yields, and investors demand a premium for that larger movement.
(Google key words like “Macaulay duration” and “Modified duration” for more details.)
Figure 3
Source: Britannica.
3. Credit risk premium
The credit risk premium compensates investors for the risk of default. For high-quality sovereign bonds like U.S. Treasuries or German Bunds, this risk is minimal under normal conditions. However, as seen during the European Sovereign Debt Crisis, investors began pricing in default risk even for sovereign bonds, such as those issued by Greece, Portugal, and Spain.
Market-based indicators like Credit Default Swaps (CDS) spreads provide a snapshot of perceived default risks. Since CDS can be viewed as insurance against debt default, their spreads reflect expectations for default. During the crisis, CDS spreads for European sovereign bonds increased significantly, signaling heightened concerns, as shown in Figure 4 below.
Figure 4 Source: Wikimedia
4. Liquidity premium
The liquidity premium compensates investors for holding bonds that are harder to trade, i.e., illiquid. The bond market is generally over-the-counter (OTC), meaning liquidity varies widely.
For example, on-the-run Treasuries (the most recently issued bonds) are highly liquid, trading heavily in secondary markets, while off-the-run Treasuries (older issues) are less so, as they are already held by investors. Investors demand a higher yield for less liquid bonds. Liquidity also typically worsens during times of market stress, such as the Global Financial Crisis of 2007-2008.
The following graph (Figure 5) shows measures of liquidity in Treasury markets from 2010 to 2024.
Figure 5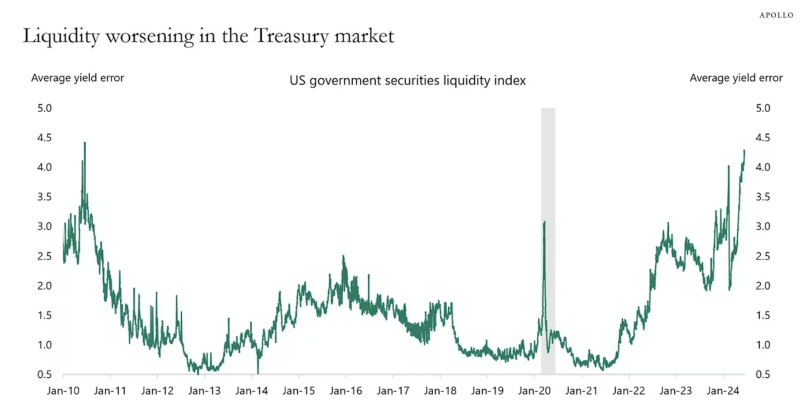
Source: Apollo.
Empirical Observations on Government Bonds Yields
In this section, let’s examine recent examples of government bond yield fluctuations and their drivers.
France: Rising Yields Amid Fiscal Uncertainty
In late November 2024, French 10-year bond yields briefly surpassed Greece’s, reaching 3.02%, reflecting concerns over France’s debt-paying ability (credit risk premium).
This was linked to uncertainty in fiscal policy and government budgetary issues. Investors worried that Michel Barnier’s government might fail to pass a €60bn belt-tightening budget due to pressure from opposition parties. Later, the spread narrowed after optimism grew that France would pass a budget, following Prime Minister Michel Barnier’s resignation.
Figure 6: Government bond yield spreads (Italy, Spain, France vs Bund)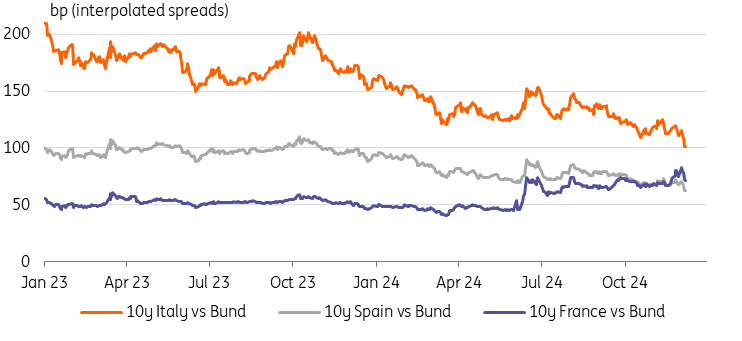
Source: Refinitiv, ING.
The UK: Soaring Gilt Yields
Earlier in January 2025, the UK’s 10-year gilt yield reached its highest level since 2008, signaling soaring borrowing costs for the government. This surge was driven by:
- The Labour government’s ambitious spending plans raised concerns about fiscal discipline (credit risk premium).
- Stagflation fears heightened inflation expectations (inflation premium).
The British government sought to quell tumult in UK bond markets by vowing to stick to its fiscal rules.
Figure 7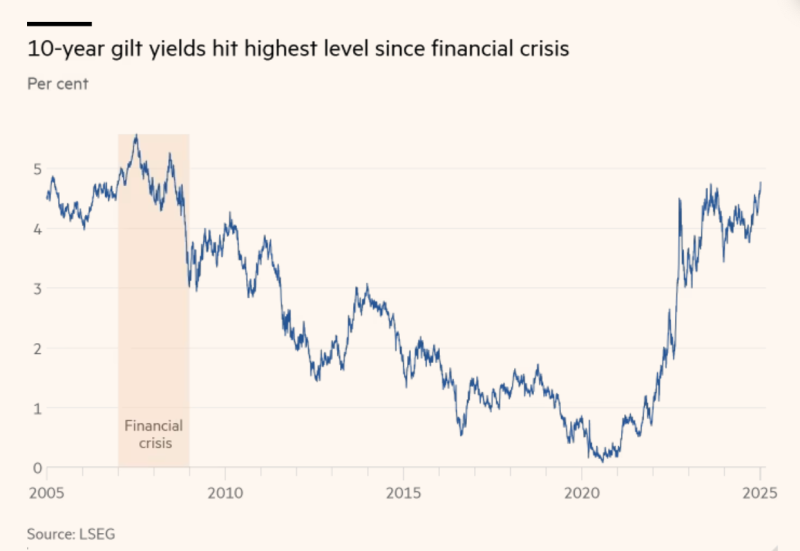
Source: Financial Times.
China: Record-Low 10-Year Bond Yields
In contrast, China’s 10-year bond yields fell to a record low of 1.6% in January 2025. This move was largely attributed to deflationary expectations and pessimism about future growth.
Crucially, the entire yield curve shifted downwards rather than steepening, suggesting investors were alarmed about the long-term outlook rather than just anticipating short-term interest rate cuts.
Figure 8 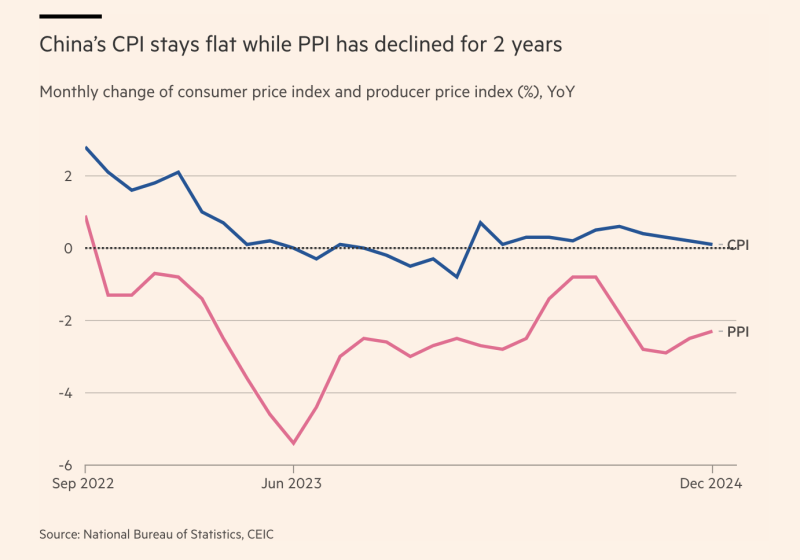
Figure 9 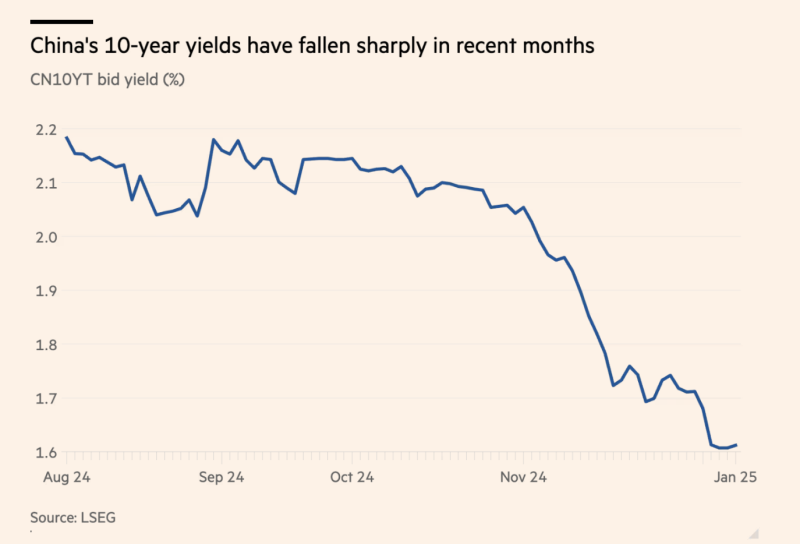
Source: Financial Times.
Bottom Line
Bond yields are more than just numbers; they reflect a combination of market expectations for returns and risks. By understanding their components, such as inflation, credit risk, and liquidity, we can better understand and even predict their movements as investors and interpret the signals they send about the entire economy.